Lognormalizer
Lognormalizer is a sample tool which is often used to test and debug rulebases before real use. Nevertheless, it can be used in production as a simple command line interface to liblognorm.
This tool reads log lines from its standard input and prints results to standard output. You need to use redirections if you want to read or write files.
An example of the command:
$ lognormalizer -r messages.sampdb -o json <messages.log
Command line options
-r <FILENAME>
Specifies name of the file containing the rulebase.
-v
Increase verbosity level. Can be used several times.
-p
Print only successfully parsed messages.
-t <TAG>
Print only those messages which have this tag.
-e <json|xml|csv>
Output format. By default, output is in Mitre CEE format. With this option, you can change it to JSON, XML or CSV.
-T
Include ‘event.tags’ attribute when output is in JSON format. This attribute contains list of tags of the matched rule.
-E <DATA>
Encoder-specific data. For CSV, it is the list of fields to be output, separated by comma or space. It is currently unused for other formats.
-d <FILENAME>
Generate DOT file describing parse tree. It is used to plot parse graph with GraphViz.
Examples
These examples were created using sample rulebase from source package.
Default (CEE) output:
$ lognormalizer -r rulebases/sample.rulebase
Weight: 42kg
[cee@115 event.tags="tag2" unit="kg" N="42" fat="free"]
Snow White and the Seven Dwarfs
[cee@115 event.tags="tale" company="the Seven Dwarfs"]
2012-10-11 src=127.0.0.1 dst=88.111.222.19
[cee@115 dst="88.111.222.19" src="127.0.0.1" date="2012-10-11"]
JSON output, flat tags enabled:
$ lognormalizer -r rulebases/sample.rulebase -e json -T
%%
{ "event.tags": [ "tag3", "percent" ], "percent": "100", "part": "wha", "whole": "whale" }
Weight: 42kg
{ "unit": "kg", "N": "42", "event.tags": [ "tag2" ], "fat": "free" }
CSV output with fixed field list:
$ lognormalizer -r rulebases/sample.rulebase -e csv -E'N unit'
Weight: 42kg
"42","kg"
Weight: 115lbs
"115","lbs"
Anything not matching the rule
,
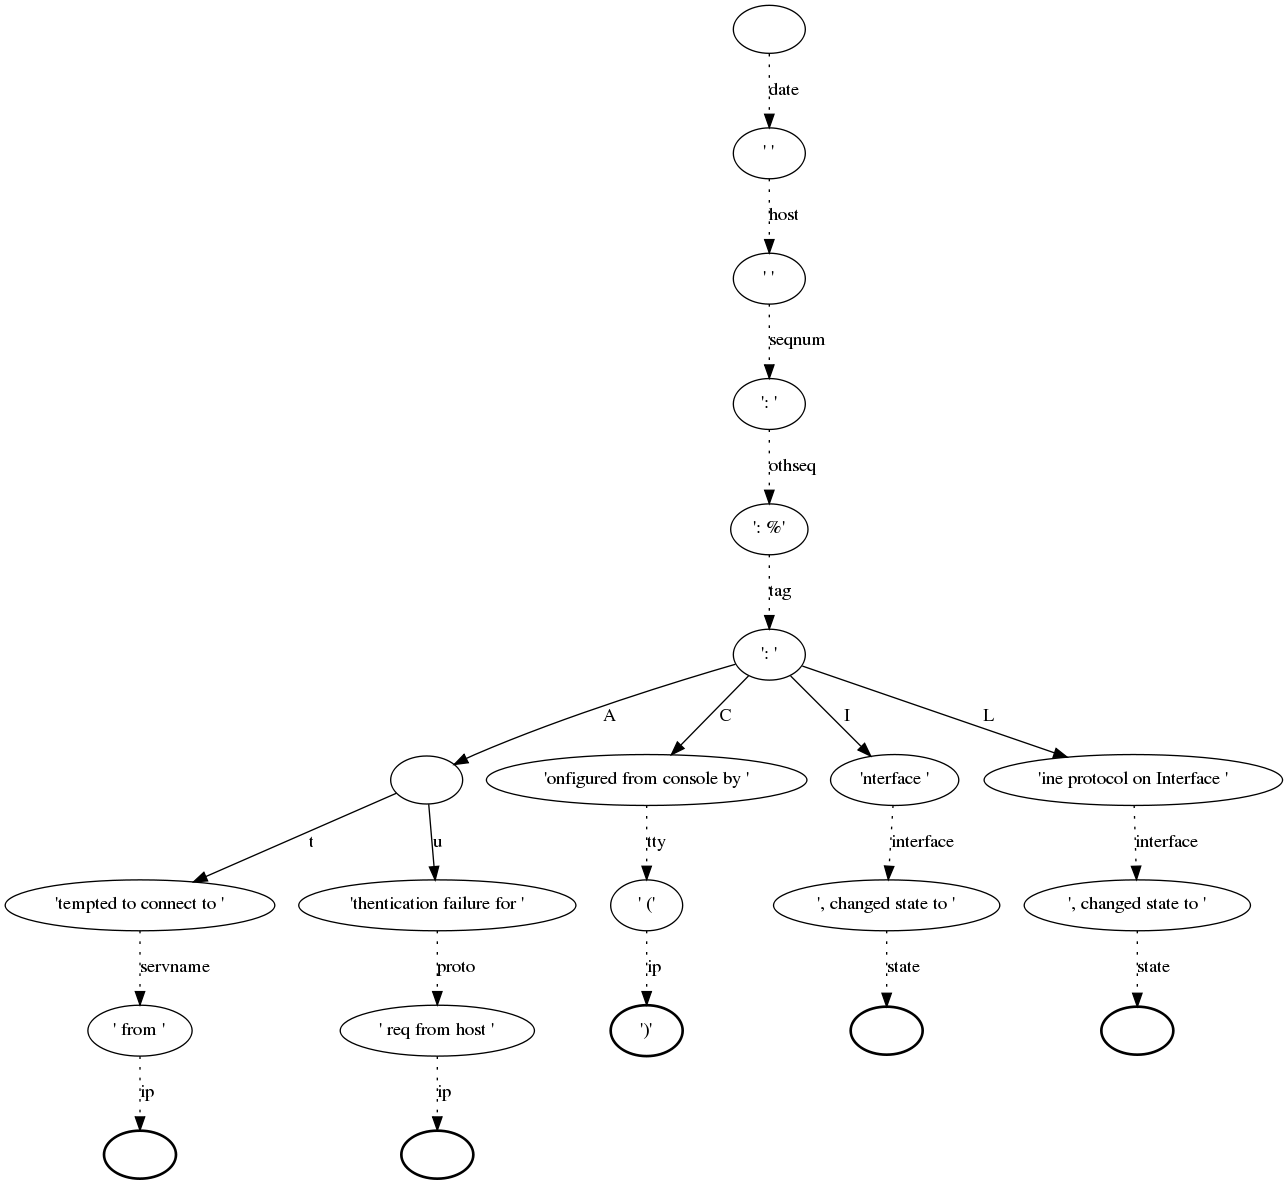
Creating a graph of the rulebase
To get a better overview of a rulebase you can create a graph that shows you the chain of normalization (parse-tree).
At first you have to install an additional package called graphviz. Graphviz is a tool that creates such a graph with the help of a control file (created with the rulebase). Here you will find more information about graphviz.
To install it you can use the package manager. For example, on RedHat systems it is yum command:
$ sudo yum install graphviz
The next step would be creating the control file for graphviz. Therefore we use the normalizer command with the options -d “prefered filename for the control file” and -r “rulebase”:
$ lognormalize -d control.dot -r messages.rb
Please note that there is no need for an input or output file. If you have a look at the control file now you will see that the content is a little bit confusing, but it includes all information, like the nodes, fields and parser, that graphviz needs to create the graph. Of course you can edit that file, but please note that it is a lot of work.
Now we can create the graph by typing:
$ dot control.dot -Tpng >graph.png
dot + name of control file + option -T -> file format + output file
That is just one example for using graphviz, of course you can do many other great things with it. But I think this “simple” graph could be very helpful for the normalizer.
Below you see sample for such a graph, but please note that this is not such a pretty one. Such a graph can grow very fast by editing your rulebase.